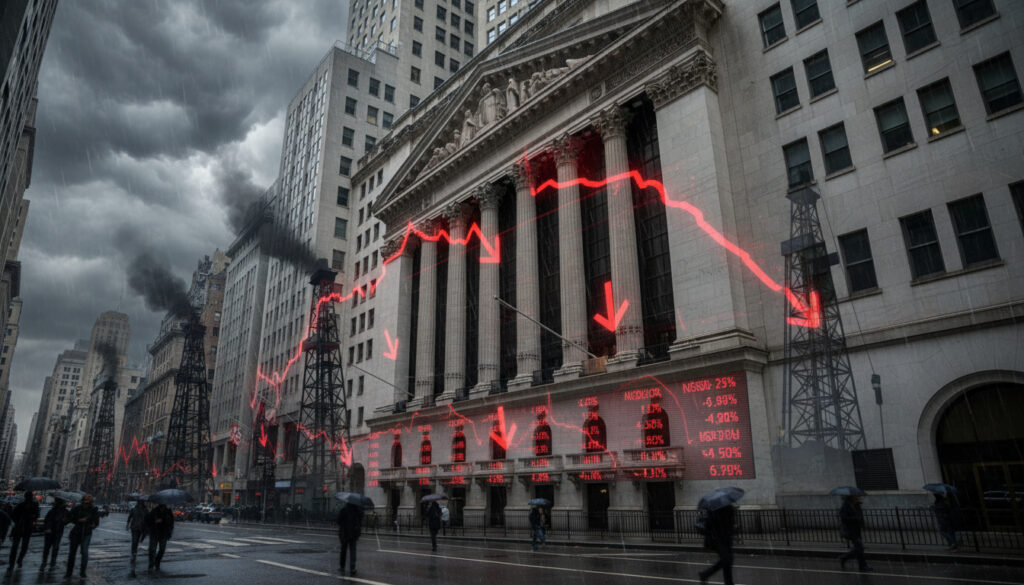
Wrap of the Day Today – US Markets Fall on Middle East Tensions
U.S. equities closed mixed to lower on March 10, 2026, as escalating military tensions in the Middle East collided with persistent inflation concerns and technology sector volatility. The session extended February’s downward pressure, with the S&P 500 registering declines near 0.9% through the recent stretch while investors digested abrupt geopolitical shocks.
An unexpected large-scale military operation involving U.S. and Israeli forces against Iran triggered severe intraday swings, pushing the Dow Jones Industrial Average down more than 1,000 points at one stage. Energy markets reacted immediately, with Brent crude surging past $100 per barrel, while defensive rotations into utilities highlighted risk-averse positioning ahead of critical inflation data.
Crosscurrents from war news, Supreme Court decisions on trade policy, and anticipation of February consumer price figures created a volatile trading environment that tested recent market support levels.
What Were the Major Market Movements on March 10, 2026?
Geopolitical Escalation
Mixed to Lower Close
4Q25 GDP at 1.4%
Utilities +10.4%
- The S&P 500 declined approximately 0.9% during the February stretch into early March, marking its first monthly loss in three months.
- The Dow Jones Industrial Average experienced intraday volatility exceeding 1,000 points following military operation announcements.
- Brent crude oil prices surged above $100 per barrel, reflecting supply risk premiums not priced into morning levels.
- Defensive sector rotation benefitted utilities, which gained 10.4%, while technology and financials each fell over 3.5%.
- Fourth-quarter 2025 GDP growth slowed to 1.4%, trailing earlier expansion rates and signaling economic deceleration.
- Recent labor market data revealed a third month of job losses within a five-month period, pressuring unemployment trends.
- The Supreme Court invalidated significant portions of existing tariff frameworks, introducing fresh policy uncertainty.
| Index/Metric | Performance/Value | Context |
|---|---|---|
| S&P 500 | -0.8% to -0.9% | First monthly loss in three months |
| Nasdaq 100 | -2.3% (February) | AI-linked valuation pressures |
| Dow Jones | Best large-cap performer* | Strong weekly gains despite intraday drops |
| MSCI EAFE | +10.1% YTD | Non-U.S. developed markets outperformance |
| MSCI EM | +14.8% YTD | Value sector support |
| Bloomberg U.S. Aggregate Bond | +1.6% | Flight-to-safety rally; 10-year yield at 3.94% |
| Brent Crude | >$100/barrel | Geopolitical risk premium surge |
| Utilities Sector | +10.4% | Defensive rotation leader |
How Did Geopolitical Tensions Impact Today’s Trading Session?
Military operations commenced without prior market warning, instantly reversing morning gains as participants priced in energy supply disruptions. The overnight initiation of U.S. and Israeli operations against Iranian targets generated immediate risk-off positioning across equity futures and spot markets.
Energy Market Shock and Sector Rotation
Energy futures led volatility, with Brent crude breaching the $100 threshold for the first time in recent periods. This price spike threatened to exacerbate existing inflationary pressures, complicating the Federal Reserve’s policy trajectory. Nuclear and uranium equities attracted capital seeking energy infrastructure exposure, with Uranium Energy Corp rising 6.7% and Vertiv Holdings reaching new highs.
Intraday Volatility and Risk-Off Flows
The Dow’s four-digit intraday decline reflected algorithmic and institutional rebalancing toward defensive postures. Communication services and financial sectors each dropped over 3.5%, while investors sought refuge in Treasury markets, driving the Bloomberg U.S. Aggregate Bond index up 1.6%.
Analysts warn that sustained oil prices above $100 per barrel could significantly slow global growth and pressure equity valuations, particularly in energy-dependent sectors.
What Economic Data and Policy Developments Moved Markets?
GDP Deceleration and Labor Market Cooling
Economic fundamentals provided little cushion against geopolitical shocks. Fourth-quarter 2025 GDP growth decelerated to 1.4%, marking a notable slowdown from previous quarters. Labor market indicators softened further, with recent data confirming a third month of job losses within a five-month window, pressuring unemployment trends and constraining consumer outlooks.
Judicial Intervention in Trade Policy
Concurrently, the Supreme Court’s invalidation of substantial portions of the previous administration’s tariff framework introduced unexpected policy uncertainty. This judicial action complicated the inflation outlook and Federal Reserve calculations regarding interest rate trajectories, according to analyst commentary.
What Does the AI-Energy Convergence Mean for Market Stability?
Technology sectors faced dual pressures from valuation corrections and power infrastructure constraints. The Nasdaq 100’s 2.3% February decline reflected concerns that AI-linked valuations had disconnected from underlying fundamentals. Simultaneously, the AI capital expenditure boom—projected at approximately $500 billion—strains national energy grids, creating physical limitations on data center expansion.
Projected AI capital expenditures approaching $500 billion are creating unprecedented demand for electrical grid capacity, directly linking technology performance to energy sector constraints.
Nvidia’s GTC conference on March 16-17, featuring “Rubin” chip architecture and Agentic AI developments, may determine whether AI valuations stabilize or face further repricing.
What Key Events Defined the Trading Session?
- March 9-10: Military operation news erases morning equity gains; nuclear/uranium stocks (UEC +6.7%, VRT new highs) demonstrate strength on energy security themes. Source: Market Analysis
- March 10 Close: Major indices finish mixed to lower amid geopolitical risk-off sentiment; defensive sector rotation accelerates. Source: Beacon Pointe
- March 11 (Scheduled): February CPI report release at 8:30 a.m. ET; consensus expects 2.4-2.5% reading. Hotter data could spike Treasury yields toward 4.5% and delay Federal Reserve rate cuts. Source: MarketMinute
- March 16-17: Nvidia GTC conference (AI “Rubin” chips, Agentic AI); AMPP Annual Conference and Utah Petroleum Association Meeting address energy-AI power demands. Source: MarketMinute
- Ongoing: AI capital expenditure boom (~$500B projected) continues pressuring electrical grid infrastructure; liquid cooling and data center stocks attract rotation. Source: Market Recap
What Is Confirmed Versus Uncertain in the Current Outlook?
| Established Facts | Pending Clarification |
|---|---|
| U.S. and Israeli military operations against Iran commenced March 9-10 | Duration and scope of military operations |
| S&P 500 declined ~0.9%; Nasdaq 100 fell 2.3% in February | Whether indices have established technical support levels |
| Brent crude exceeded $100/barrel | Sustainability of elevated energy prices |
| 4Q25 GDP growth registered 1.4% | Impact on 1Q26 economic activity |
| Supreme Court invalidated major tariff portions | Subsequent trade policy replacement mechanisms |
| February CPI report scheduled for March 11, 8:30 a.m. ET | Actual inflation reading and market reaction |
How Does Today’s Market Wrap Fit Into Broader Financial Trends?
The March 10 session represents a critical stress test for the “soft landing” narrative that dominated earlier quarters. February’s U.S. equity declines—contrasted with MSCI EAFE’s 10.1% and MSCI EM’s 14.8% year-to-date gains—highlight divergent regional performance driven by currency dynamics and energy import dependencies.
Current volatility echoes historical “March Madness” patterns observed during 1970s inflationary periods, though with distinct modern characteristics including algorithmic trading and AI productivity potential. The bond market’s response confirms institutional flight-to-safety behaviors amid geopolitical uncertainty. Additional perspective is available in the Commonwealth market analysis.
What Are Experts Saying About Today’s Market Conditions?
U.S. equities endured a challenging February… reflecting broad risk-off positioning amid geopolitical escalation, sticky inflation data, and concerns that AI-linked valuations had run ahead of fundamentals.
— Beacon Pointe
The convergence of persistent energy-driven inflation and the next evolutionary leap in AI is creating a volatile cocktail… tech and energy are becoming inextricably linked.
— MarketMinute
The market reaction has already been significant… If oil spikes towards $100 a barrel, it could slow global growth and hurt equities bad.
— Market Recap Analysis
What Is the Essential Takeaway From Today’s Wrap?
March 10, 2026, delivered a stark reminder that geopolitical shocks can override technical support levels in moments, with military escalation in the Middle East triggering immediate risk-off rotations and energy price spikes. As markets await February inflation data and upcoming AI infrastructure announcements, investors face a bifurcated landscape where defensive positioning and energy-technology convergence define near-term strategy. For comprehensive monthly analysis, see the Beacon Pointe of View: A Market Update – March 2026.
Frequently Asked Questions
Why did utility stocks outperform on March 10?
Utilities gained 10.4% as investors rotated into defensive sectors amid geopolitical uncertainty and spiking energy prices, seeking stable dividend yields.
What caused the Dow Jones to drop over 1,000 points?
Intraday volatility followed the announcement of U.S. and Israeli military operations against Iran, triggering algorithmic selling and risk-off repositioning.
When will the February CPI report be released?
The Consumer Price Index report for February 2026 releases March 11 at 8:30 a.m. ET, with expectations centered around 2.4-2.5% annual inflation.
How did the Supreme Court tariff decision affect markets?
The invalidation of major tariff portions introduced policy uncertainty, complicating Federal Reserve inflation calculations and contributing to risk-off sentiment.
What is the significance of AI-energy convergence?
Approximately $500 billion in projected AI capital expenditure strains electrical grids, creating physical infrastructure constraints that directly impact technology sector growth capabilities.
Why did Brent crude surpass $100 per barrel?
Military operations in the Middle East triggered supply risk premiums, pushing Brent crude above $100 as traders priced potential disruptions to regional energy exports.
What is the current federal funds rate?
The federal funds rate remains at 3.50%-3.75%, with markets uncertain whether the Federal Reserve will delay cuts pending upcoming inflation data.
Which stocks benefited from today’s geopolitical news?
Nuclear and uranium stocks including Uranium Energy Corp (UEC) rose 6.7%, while Vertiv Holdings (VRT) reached new highs on energy infrastructure demand.
More related posts
 Race Across the World Experience: Worth It? Cost & How It Works
 New Century Hall Manchester: Capacity, Events & Visitor Guide
 What Is a Pronoun – Definition, Types and Examples
 Air Max TL 2.5 – Features, Prices and Design History
 Jake Paul Anthony Joshua – Fight Recap and 2026 Outlook
 When Is the Champions League Final – 2026 Date, Venue and Tickets
 South Africa vs India Match Scorecard – 2025 Test & ODI Results
